
Our ability as forensic investigators to efficiently and effectively detect and contain malicious actors in the face of growing sophistication of threats posed by adversaries hinges on visibility into the current system state of our endpoint.
In this post, we discuss the various data structures of the internals of a Windows process that are valuable from a forensic standpoint. Although no programming is intended here, the reader will need a basic understanding of C to comprehend this post.
Windows Process Internals: Basic Concept
In this section, we discuss some basic concepts that will aid better understanding of this post.
Thread
A thread is the basic unit of CPU execution. It is a small execution unit within a process. Threads reduce overhead by sharing the resources of a process. In most operating systems, a thread exists within a process. In other words, a single process can contain multiple threads. All threads within a process share code and data segments. A thread is also known as a lightweight process. A thread comprises the following:
- The contents of a set of CPU registers representing the state of the processor
- Two Stacks - One for the thread to use while executing in kernel mode and one for executing in user mode.
- A private storage area called thread-local storage (TLS) for use by subsystems runt-time libraries, and DLLs.
- A unique identifier called a thread ID (part of an internal structure called a client ID; process IDs and thread IDs are generated out of the same namespace, so they never overlap).
 | |
| Figure 1: Windows process internals |
Process
A process is an instance of a computer program or executable that is being executed by one or many threads. It contains the program code and its activity. When a computer program is loaded into memory, it becomes a process which performs all the instructions written in the program.
At the highest level of abstraction, a process comprises the following:
|
COMPONENTS OF A WINDOWS PROCESS |
|
|
Private Virtual Address Space |
Set of virtual memory addresses that the process can use. This is distinct from other processes’ address spaces. |
|
Executable Program |
This defines initial code and is mapped into the virtual address spaces of the process. |
|
List of Open Handles |
Used to map various resources such as Semaphores, Synchronization objects, and files that are accessible to all threads in the process. |
|
Security Context |
Access token that defines the user, |
|
Process ID |
This is a unique identifier, which is internally part of an identifier called a client ID. |
|
List of Threads of Execution |
Every process is divided into
sub-processes which are assigned some task to complete. This
sub-process is known as thread. Every process
has at least one thread. Although an “empty” process is possible, it is (mostly)
not useful. |
Windows Process Internals
In this section, we describe the Windows process data structure maintained by various parts of the system and we will analyse them with the appropriate tools.
_EPROCESS
Each process in Windows is represented by an executive process (EPROCESS) structure. It is the basic data structure that stores various attributes of the process and the pointer to the other attributes and data structures related to the process.
 |
| Source: infosavvy.com |
The EPROCESS structures are connected to each other via a doubly linked list called ActiveProcessLinks. This is a pointer to a circular doubly linked list that tracks all active processes. The next process in the list is referenced by FLink and the previous process object is referenced by the BLink pointer.
 |
| Figure 3 - EPROCESS LinkedList |
The _EPROCESS gives us the PID and parent PID of a given process. Analysing PID relationships between processes can reveal malware. The code below shows the layout of the _EPROCESS structure.
   typedef struct _EPROCESS
{
     KPROCESS Pcb;
     EX_PUSH_LOCK ProcessLock;
     LARGE_INTEGER CreateTime;
     LARGE_INTEGER ExitTime;
     EX_RUNDOWN_REF RundownProtect;
     PVOID UniqueProcessId;
     LIST_ENTRY ActiveProcessLinks;
     ULONG QuotaUsage[3];
     ULONG QuotaPeak[3];
     ULONG CommitCharge;
     ULONG PeakVirtualSize;
     ULONG VirtualSize;
     LIST_ENTRY SessionProcessLinks;
     PVOID DebugPort;
     union
     {
          PVOID ExceptionPortData;
          ULONG ExceptionPortValue;
          ULONG ExceptionPortState: 3;
     };
     PHANDLE_TABLE ObjectTable;
     EX_FAST_REF Token;
     ULONG WorkingSetPage;
     EX_PUSH_LOCK AddressCreationLock;
     PETHREAD RotateInProgress;
     PETHREAD ForkInProgress;
     ULONG HardwareTrigger;
     PMM_AVL_TABLE PhysicalVadRoot;
     PVOID CloneRoot;
     ULONG NumberOfPrivatePages;
     ULONG NumberOfLockedPages;
     PVOID Win32Process;
     PEJOB Job;
     PVOID SectionObject;
     PVOID SectionBaseAddress;
     _EPROCESS_QUOTA_BLOCK * QuotaBlock;
     _PAGEFAULT_HISTORY * WorkingSetWatch;
     PVOID Win32WindowStation;
     PVOID InheritedFromUniqueProcessId;
     PVOID LdtInformation;
     PVOID VadFreeHint;
     PVOID VdmObjects;
     PVOID DeviceMap;
     PVOID EtwDataSource;
     PVOID FreeTebHint;
     union
     {
          HARDWARE_PTE PageDirectoryPte;
          UINT64 Filler;
     };
     PVOID Session;
     UCHAR ImageFileName[16];
     LIST_ENTRY JobLinks;
     PVOID LockedPagesList;
     LIST_ENTRY ThreadListHead;
     PVOID SecurityPort;
     PVOID PaeTop;
     ULONG ActiveThreads;
     ULONG ImagePathHash;
     ULONG DefaultHardErrorProcessing;
     LONG LastThreadExitStatus;
     PPEB Peb;
     EX_FAST_REF PrefetchTrace;
     LARGE_INTEGER ReadOperationCount;
     LARGE_INTEGER WriteOperationCount;
     LARGE_INTEGER OtherOperationCount;
     LARGE_INTEGER ReadTransferCount;
     LARGE_INTEGER WriteTransferCount;
     LARGE_INTEGER OtherTransferCount;
     ULONG CommitChargeLimit;
     ULONG CommitChargePeak;
     PVOID AweInfo;
     SE_AUDIT_PROCESS_CREATION_INFO SeAuditProcessCreationInfo;
     MMSUPPORT Vm;
     LIST_ENTRY MmProcessLinks;
     ULONG ModifiedPageCount;
     ULONG Flags2;
     ULONG JobNotReallyActive: 1;
     ULONG AccountingFolded: 1;
     ULONG NewProcessReported: 1;
     ULONG ExitProcessReported: 1;
     ULONG ReportCommitChanges: 1;
     ULONG LastReportMemory: 1;
     ULONG ReportPhysicalPageChanges: 1;
     ULONG HandleTableRundown: 1;
     ULONG NeedsHandleRundown: 1;
     ULONG RefTraceEnabled: 1;
     ULONG NumaAware: 1;
     ULONG ProtectedProcess: 1;
     ULONG DefaultPagePriority: 3;
     ULONG PrimaryTokenFrozen: 1;
     ULONG ProcessVerifierTarget: 1;
     ULONG StackRandomizationDisabled: 1;
     ULONG Flags;
     ULONG CreateReported: 1;
     ULONG NoDebugInherit: 1;
     ULONG ProcessExiting: 1;
     ULONG ProcessDelete: 1;
     ULONG Wow64SplitPages: 1;
     ULONG VmDeleted: 1;
     ULONG OutswapEnabled: 1;
     ULONG Outswapped: 1;
     ULONG ForkFailed: 1;
     ULONG Wow64VaSpace4Gb: 1;
     ULONG AddressSpaceInitialized: 2;
     ULONG SetTimerResolution: 1;
     ULONG BreakOnTermination: 1;
     ULONG DeprioritizeViews: 1;
     ULONG WriteWatch: 1;
     ULONG ProcessInSession: 1;
     ULONG OverrideAddressSpace: 1;
     ULONG HasAddressSpace: 1;
     ULONG LaunchPrefetched: 1;
     ULONG InjectInpageErrors: 1;
     ULONG VmTopDown: 1;
     ULONG ImageNotifyDone: 1;
     ULONG PdeUpdateNeeded: 1;
     ULONG VdmAllowed: 1;
     ULONG SmapAllowed: 1;
     ULONG ProcessInserted: 1;
     ULONG DefaultIoPriority: 3;
     ULONG SparePsFlags1: 2;
     LONG ExitStatus;
     WORD Spare7;
     union
     {
          struct
          {
               UCHAR SubSystemMinorVersion;
               UCHAR SubSystemMajorVersion;
          };
          WORD SubSystemVersion;
     };
     UCHAR PriorityClass;
     MM_AVL_TABLE VadRoot;
     ULONG Cookie;
     ALPC_PROCESS_CONTEXT AlpcContext;
} EPROCESS, *PEPROCESS;
Values of forensic significance include the following.
    KPROCESS Pcb; //Process Control Block
    LARGE_INTEGER CreateTime; //Time when the process was started
    LARGE_INTEGER ExitTime; //Exit time of the process - process is still stored in the process list for some time after it exits, which allows for graceful deallocation of other process structures
    PVOID UniqueProcessID; //PID of the process
    LIST_ENTRY ActiveProcessLinks; //Doubly-linked list to the EPROCESS structures (process lists) of other process
    PHANDLE_TABLE ObjectTable; //Pointer to the process' handle table
    PPEB Peb; //Pointer to the Process Environment Block
    PVOID InheritedFromUniqueProcessId; //The Parent PID
    LIST_ENTRY ThreadListHead; //List of active threads (_ETHREAD)
    MM_AVL_TABLE VadRoot; //Pointer to the root of the VAD tree
The EPROCESS and most of its related data structures exist in system (kernel) address space. One exception is the Process Environment Block (PEB), which exists in the process (user) address space (because it contains information accessed by user-mode code).
PROCESS ENVIRONMENT BLOCK (_PEB)
The Process Environment Block (PEB) is one of the structures that EPROCESS points to. It contains data structures that apply across a whole process and is stored in user-mode memory which makes it accessible for the corresponding process.
The PEB contains the full path to the process’ executable, the full command line that started the process, the current working directory, pointers to the process’ heaps, standard handles, and three doubly linked lists that contain the full path to DLLs loaded by the process.
 |
| Figure 4: Process Environment Block |
It contains a flag that tells whether a debugger is attached to a process. Some malwares will debug a child process as an anti-reversing measure. The code below shows the layout of the PEB structure.
  typedef struct _PEB
{
     UCHAR InheritedAddressSpace;
     UCHAR ReadImageFileExecOptions;
     UCHAR BeingDebugged;
     UCHAR BitField;
     ULONG ImageUsesLargePages: 1;
     ULONG IsProtectedProcess: 1;
     ULONG IsLegacyProcess: 1;
     ULONG IsImageDynamicallyRelocated: 1;
     ULONG SpareBits: 4;
     PVOID Mutant;
     PVOID ImageBaseAddress;
     PPEB_LDR_DATA Ldr;
     PRTL_USER_PROCESS_PARAMETERS ProcessParameters;
     PVOID SubSystemData;
     PVOID ProcessHeap;
     PRTL_CRITICAL_SECTION FastPebLock;
     PVOID AtlThunkSListPtr;
     PVOID IFEOKey;
     ULONG CrossProcessFlags;
     ULONG ProcessInJob: 1;
     ULONG ProcessInitializing: 1;
     ULONG ReservedBits0: 30;
     union
     {
          PVOID KernelCallbackTable;
          PVOID UserSharedInfoPtr;
     };
     ULONG SystemReserved[1];
     ULONG SpareUlong;
     PPEB_FREE_BLOCK FreeList;
     ULONG TlsExpansionCounter;
     PVOID TlsBitmap;
     ULONG TlsBitmapBits[2];
     PVOID ReadOnlySharedMemoryBase;
     PVOID HotpatchInformation;
     VOID * * ReadOnlyStaticServerData;
     PVOID AnsiCodePageData;
     PVOID OemCodePageData;
     PVOID UnicodeCaseTableData;
     ULONG NumberOfProcessors;
     ULONG NtGlobalFlag;
     LARGE_INTEGER CriticalSectionTimeout;
     ULONG HeapSegmentReserve;
     ULONG HeapSegmentCommit;
     ULONG HeapDeCommitTotalFreeThreshold;
     ULONG HeapDeCommitFreeBlockThreshold;
     ULONG NumberOfHeaps;
     ULONG MaximumNumberOfHeaps;
     VOID * * ProcessHeaps;
     PVOID GdiSharedHandleTable;
     PVOID ProcessStarterHelper;
     ULONG GdiDCAttributeList;
     PRTL_CRITICAL_SECTION LoaderLock;
     ULONG OSMajorVersion;
     ULONG OSMinorVersion;
     WORD OSBuildNumber;
     WORD OSCSDVersion;
     ULONG OSPlatformId;
     ULONG ImageSubsystem;
     ULONG ImageSubsystemMajorVersion;
     ULONG ImageSubsystemMinorVersion;
     ULONG ImageProcessAffinityMask;
     ULONG GdiHandleBuffer[34];
     PVOID PostProcessInitRoutine;
     PVOID TlsExpansionBitmap;
     ULONG TlsExpansionBitmapBits[32];
     ULONG SessionId;
     ULARGE_INTEGER AppCompatFlags;
     ULARGE_INTEGER AppCompatFlagsUser;
     PVOID pShimData;
     PVOID AppCompatInfo;
     UNICODE_STRING CSDVersion;
     _ACTIVATION_CONTEXT_DATA * ActivationContextData;
     _ASSEMBLY_STORAGE_MAP * ProcessAssemblyStorageMap;
     _ACTIVATION_CONTEXT_DATA * SystemDefaultActivationContextData;
     _ASSEMBLY_STORAGE_MAP * SystemAssemblyStorageMap;
     ULONG MinimumStackCommit;
     _FLS_CALLBACK_INFO * FlsCallback;
     LIST_ENTRY FlsListHead;
     PVOID FlsBitmap;
     ULONG FlsBitmapBits[4];
     ULONG FlsHighIndex;
     PVOID WerRegistrationData;
     PVOID WerShipAssertPtr;
} PEB, *PPEB;
  UCHAR BeingDebugged; //Is a debugger attached to the process
  PVOID ImageBaseAddress; //Virtual address where the executable is loaded
  PPEB_LDR_DATA Ldr; //Pointer to _PEB_LDR_DATA structure
  PRTL_USER_PROCESS_PARAMETERS ProcessParameters; //Full path name and command-line parameters
PEB Loader Data (_PEB_LDR_DATA)
This maintains a list of all modules (DLLs as well as the primary executable) that has been loaded by a process. This information is stored in the _PEB - namely in a structure identified by Ldr and called PEB_LDR_DATA. In the structure, the loader maintains three doubly linked lists, all containing the same information but ordered differently (either by load order, memory location, or initialization order). These lists contain structures called loader data table entries (LDR_DATA_TABLE_ENTRY) that store information about each module. Sometimes malware will inject a DLL into a legitimate Windows service, then try to hide. But they’d better hide from all three lists or, you’ll detect it without difficulty.
 |
| Figure 5: Ldr modules |
Each process has one PEB_LDR_DATA. Its address is kept in the Ldr member of the process’s PEB. The code below shows the layout of the PEB_LDR_DATA structure.
  typedef struct _PEB_LDR_DATA
{
     ULONG Length;
     UCHAR Initialized;
     PVOID SsHandle;
     LIST_ENTRY InLoadOrderModuleList;
     LIST_ENTRY InMemoryOrderModuleList;
     LIST_ENTRY InInitializationOrderModuleList;
     PVOID EntryInProgress;
} PEB_LDR_DATA, *PPEB_LDR_DATA;
    LIST_ENTRY InLoadOrderModuleList; //List of loaded DLLs
    LIST_ENTRY InMemoryOrderModuleList; //List of loaded DLLs
    LIST_ENTRY InInitializationOrderModuleList; //List of loaded DLLs
The Ldr modules fetches the information about loaded dlls from the above three lists.
LDR_DATA_TABLE_ENTRY
  typedef struct _LDR_DATA_TABLE_ENTRY
{
     LIST_ENTRY InLoadOrderLinks;
     LIST_ENTRY InMemoryOrderLinks;
     LIST_ENTRY InInitializationOrderLinks;
     PVOID DllBase;
     PVOID EntryPoint;
     ULONG SizeOfImage;
     UNICODE_STRING FullDllName;
     UNICODE_STRING BaseDllName;
     ULONG Flags;
     WORD LoadCount;
     WORD TlsIndex;
     union
     {
          LIST_ENTRY HashLinks;
          struct
          {
               PVOID SectionPointer;
               ULONG CheckSum;
          };
     };
     union
     {
          ULONG TimeDateStamp;
          PVOID LoadedImports;
     };
     _ACTIVATION_CONTEXT * EntryPointActivationContext;
     PVOID PatchInformation;
     LIST_ENTRY ForwarderLinks;
     LIST_ENTRY ServiceTagLinks;
     LIST_ENTRY StaticLinks;
} LDR_DATA_TABLE_ENTRY, *PLDR_DATA_TABLE_ENTRY;
    PVOID DllBase; //The base address of the DLL
    PVOID EntryPoint; //Entry point of the DLL
    ULONG SizeOfImage; //Size of the DLL in Memory
    UNICODE_STRING FullDllName; //Full path name of the DLL
    ULONG TimeDateStamp; //The compile time stamp for the DLL
Kernel Debugger Data Block (_KDDEBUGGER_DATA64)
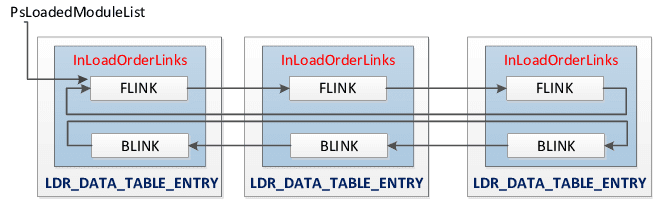
- PsLoadedModuleList - Pointer to the list of the loaded kernel modules
- PsActiveProcessHead - Pointer to the list head of the active process
- PspCidTable - Table of processes used by the scheduler
- MmUnloadedDrivers - List of recently unloaded drivers.
The PsLoadedModuleList structure of the KDBG points to the list of loaded kernel modules (device drivers) in memory. Many malware variants use kernel modules because they require low level access to the system. Rootkits, packet sniffers, and many keyloggers use may be found in the loaded modules list. The members of the list are _LDR_DATA_TABLE_ENTRY structures. Stuxnet, Duqu, Regin, R2D2, Flame, etc., have all used some kernel mode module component – so this is a great place to look for advanced (supposed) nation-state malware. However, note that some malware has the ability to unlink itself from this list, so scanning for structures may also be necessary.
Post a Comment