
- Volatile evidence.
- Non-volatile evidence.
 |
| Figure I: Digital evidence types |
Volatile Evidence
Volatile evidence or data refers to the information on a digital device that will be lost when the power supply to the device is interrupted or the machine is shut down.
Volatile memory is not only limited to computers; for example, networking devices like routers and switches can also have volatile data stored in their logs. The process of capturing data from volatile memory is known as dumping, and acquiring it differs according to each operating system type.
Non-volatile Evidence
These refers to permanent data stored on secondary storage devices such as hard disks, USB drives, CD/DVD, and other storage devices. These type of data do not depend on power supply and usually remains intact even when power supply is interrupted or the device is shut down.
Information stored in non-volatile form include hidden files, slack space, unallocated clusters, unused/hidden partitions, event logs, registry settings, etc.
Importance of Volatile Evidence
Volatile data give an insight into the current state of the suspicious machine. It tells you about the logged-in users, processes that are running, and open ports with their remote connection. From a broader perspective, you can get the timeline of the suspicious machine, who, what and why they were using the machine when the incident happened. You can also get the date/time and the user who is likely responsible for the security incident.
Volatile data give an investigator a broader perspective, an idea about the whole scenario, and how to proceed with the case.
There are mainly two types of volatile information that
an investigator has to collect during the process:
- Volatile System Information → This include the currently running processes and the configuration of the system.
- Volatile Network Information → This include information about the network, open ports, and the connectivity of the suspect machine.
Before proceeding to investigate the target system, you must prepare a USB drive for acquisition which must meet the below requirements.
- It must have enough space to store the memory image.
- It must be sterilized by wiping.
Information obtained from the analysis including the RAM image must be saved on the USB drive and not on the target system. This is very important please.
NOTE: This action will, of course, leave trace evidence in the Windows Registry, Memory, and Hard Drive.
Once the drive has been inserted we can formulate a new command that redirects the output of a command to the evidence drive. A good way to achieve this is to invoke the Microsoft PowerShell that has many additional capabilities that include creating a transcript of all activity. You can invoke the PowerShell from within the Command Prompt as follows.
 |
| Figure II: Invoking powershell from the command line |
Once in the PowerShell, you can invoke the transcription service that will then log all of your operations. You invoke the transcription service as follows. (Note this assumes that you have inserted a removable drive D: that will store your evidence.)
| Figure III: Invoking powershell transcription service |
At this point you can execute PowerShell commands. These commands and their corresponding results will be written to the evidence.log file.
Profiling the System
An investigator has to get the profile of the system. Typically, the following information should be collected to compile the system profile:
- OS type and version
- The total amount of physical memory
- System installation date
- Pagefile location
- Registered owner
- Installed physical hardware and configuration
- System directory
- Installed software applications
The systeminfo command can reveal important details regarding the current system and the general running state of the computer under investigation. A truncated output is shown below.
 |
| Figure IV: systeminfo command |
Current System Uptime
It is worthwhile to check the system uptime to know the time when the suspicious machine was started. It also helps you to understand whether the incident occurred during the uptime period or someone else has rebooted after the incident.
net statistics workstation
 |
| Figure V: System uptime |
Logged-on Users
The built-in tool wmic can be used to list the currently logged-on users; run the query
 |
| Figure VI: wmic query to determine logged-on users |
The above command is not a recognized cmdlet, so PowerShell will flag an error message. You may want to run this on the command prompt (switch by typing cmd on PowerShell) and manually copy and paste it into the evidence.log file located in the USB drive used for the investigation (D:\ in my own case).
System Memory
When the system is running low on physical memory because of the number of applications that are running, or certain applications like web browsers are caching large amounts of information, Windows automatically moves the least used “pages” of memory out to a hidden file named pagefile.sys. To determine where the pagefile.sys file is, along with some information about it, we can utilize a wmic command as shown below
 |
| Figure VII: pagefile information |
Under normal conditions Windows marks the file as a hidden system file. In order to reveal the basic file information we use another command to examine the file system contents—the dir command.
 |
| Figure VIII: Viewing hidden system information |
As you can see pagefile.sys is listed here as expected and is quite
large - 6.7 GB. There are two other memory files that are of interest - hiberfil.sys and
swapfile.sys. The hiberfil.sys does not
show up in the above output because I have disabled it on my PC. When enabled,
the hiberfil.sys provides a great resource of memory analysis. This file
contains the kernel and all the applications and the application state as of
the last hibernation point. Since this is a Windows 10 system, there is also a
swapfile.sys which can provide investigative clues depending on the user’s use
of Metro applications.
Now that we see that memory rich files are available and potentially useful, there is a catch. These files are locked by the system during normal operations and cannot be read by users or even the administrator via the command line. However, we have two options.
- We can use third party tools that can copy these files.
- We can simply note that these files are available and should be examined at a later time.
Running Processes and Services
The applications, associated processes, and system services that are running or in use can provide useful investigative information and of course, provide a baseline of the state of the system under investigation. The objective is to identify the malicious service, and software running on the machine. To perform this operation from the command line, we use the tasklist command.
Harlan Carvey has suggested documenting the following information about running processes.
- The process' executable image
- The command line used to initiate the process
- How long the process has been running
- The security context that it runs in
- Modules or libraries (DLLs) it accesses
- Memory that the process consumes
The command tasklist lists the processes running on a Windows system, including their name and PID. To keep this simple, first I will execute the command with no options and pipe the output to the sort command. This will sort the tasklist alphabetically making it easier to review the results for brevity.

There is a better way to execute the above command to obtain additional information. First, you should specify the/V or verbose option, which will provide greater details regarding each process. Next you could use format output option /FO to specify the type of output. Two popular output formats are TABLE and CSV (comma separated value). This is valuable if you plan to analyze the running processes and services later using a spreadsheet program like Microsoft Excel.

The above output follows the order specified below:
"Image Name","PID","Session Name","Session#","Mem Usage","Status", "User Name","CPU Time","Window Title"
To better understand the resulting output along with the potential forensic, consider the table below

As you can see the verbose output provides much greater detail and context for the investigator.
You may want to focus your examination to specific sections on the tasklist. There are many filters available for this purpose. The filter shown below outputs only processes that have SESSIONNAME other that is not equal to CONSOLE (the ne stands for NOT EQUAL). Thus the output of the command results is a list of Services rather than user launched processes.

Processes named svchost.exe are used to run Windows services. The list of running services is available with the /svc flag.

Attackers have recognized the value of using svchost.exe as a cover for their malware; any process named svchost.exe without corresponding Windows services should be treated as suspicious. The sc command can be used to provide the description of a service.
To find the description of WinHttpAutoProxySvc from PID 480 above, enter the following command.

Extended information about the state of a service can be found with the below command

When examining processes, we would also like to map the dynamic link libraries that are loaded by all processes or by a specific process. The below command does this for chrome.exe.

NOTE: It is important to note that most advanced malicious applications attach themselves to legitimate processes, therefore the examination of memory snapshots are necessary to provide a complete picture of the running processes and associated DLL’s. However, tasklist provides a great starting point and baseline for our investigative process.
To get a list of all available attributes of all running process, the following command will be helpful.

This can help determine what is running including potentially exploitable software, malware, and other tools.
The Sysinternals tool Process Explorer (procexp.exe) when run as administrator provides a more feature-rich tool to manage running processes. Process Explorer color codes the process name by the process type.
- Green → New processes
- Red → Deleted processes
- Gray-blue → Processes run by the same user running process explorer
- Pink → Services
- Purple → Packed processes: meaning that they are compressed or encrypted. Though some legitimate processes are packed, some malware also use this technique.
- Yellow → .NET processes or DLLs that have been rebased in memory.
- Brown → Jobs
- Teal → Immersive processes; these are only found on Windows 8, Windows server 2012, and later operating systems.

Process Explorer can verify that processes on the system are running with verified signatures; from the Options menu select Verify Image Signatures. An additional column is shown; if the application is signed, then the publisher is listed. Though many legitimate applications are signed, not all are.

Process Explorer can submit the hashes of running processes to VirusTotal for analysis. VirusTotal checks the submission against different antivirus tools. When VirusTotal is used with Process Explorer (navigate Options ➤ VirusTotal.com ➤ Check VirusTotal.com), a new column appears in the display indicating the number of antivirus products that considered the file malicious and the total number of antivirus products checked. Clicking on the hyperlink in that column takes the user to the corresponding web page on VirusTotal.com.

Double-clicking on any process brings up a dialog box with the properties of that process.

An open source tool that provides many of the features of Process Explorer is Process Hacker.
The Sysinternals tool Process Monitor (procmon.exe) records input and output for processes, including file access, network access, and registry access. Content data is not recorded, though the process stack is.

Process Monitor captures an enormous amount of data on a running system: far too much to be analyzed live. The events recorded by Process Monitor can be saved for later analysis; this subsequent analysis can even be done on a different system. To do this navigate to File ➤ Save and make selections as shown below.

There is a sysinternals tool that can also be used to determine the logged on users.

There is a sysinternal tool that can be used to determine the logged on sessions. However, this must be run as administrator. A truncated output is shown below.

Active Network Activities
Now that we can identify the running processes and specific details related to these processes, we need to take a look at how those processes are communicating with the external environment via the network. From the command line we can use the netstat command to probe active network information.
To determine the command line operation of netstat we query the help command.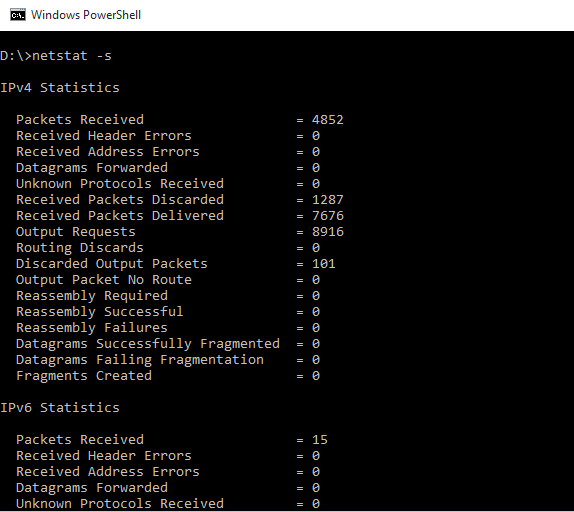
This command provides statistics surrounding general IPv4 and IPv6, ICMPv4 and ICMPv6, and Transmission Control Protocol (TCP)/User Datagram Protocol (UDP) over IPv4/IPv6 activities. This provides a baseline of the recent network activity on this computer (activity since the last reboot).
To use netstat to show the listening ports, use the /a switch; to have the ports displayed in numeric form, use /n; and to include the PID of the process that opened the port, use /o.

This is a lot of information to process and investigate. It is certainly reasonable to capture this and store it as the baseline. The table below gives more meaning to the information displayed in the above command

The name of the process that opened the connection is available with the /b switch, though this requires an Administrator level command prompt. The /f switch displays the name rather than the IP address for destinations. The /p flag filters the results by protocols; for example, to see just TCP listening ports on IPv6, run

Next we would connect the network activity with the specific processes that were generated from the tasklist command. Examining the results of the tasklist command, we can easily identify a couple of processes that should have active network connections (eg chrome.exe PID 4060). Let’s say we wish to only output information related to this process and only display the results if the connection state is equal to ESTABLISHED. We can accomplish this by connecting the output of the netstat command with the findstr command using a pipe operator (|).
netstat -ano | findstr 4060 | findstr ESTABLISHED
One additional area of concern is that of the current routing table. Routing tables are basically a set of rules that govern how IP packets are directed. All devices, including computers, switches, routers, firewalls, and other network appliances contain a routing table. Since routing tables contain specific IP addresses, if the tables were to be maliciously altered (often referred to as poisoning) packets could be directed to intermediary network devices in order to intercept or alter the packets leaving a network based on these poisoned routing rules.
Before turning off or shutting down the system it is prudent to capture the current state of the routing table, as the table is typically not persistent and would be more difficult to reconstruct postmortem.

The results include an Interface list that identifies all current network interfaces, including Bluetooth, Payment Card Industry (PCI) hardwired interfaces, wireless, and VMware virtual interfaces. It also, includes the IPv4 and IPv6 routing tables governing the direction of packets based on IP type.
The Sysinternals tool TCPView (tcpview.exe) provides a graphical way to view network connections on the system. Each connection is color coded: new in green, recently closed in red, and connections that have recently changed state in yellow.

The Windows Command Line provides investigators with numerous options when performing live investigations. These commands, if selected carefully, can gather on-scene clues about the system under investigation with minimal impact on the integrity of the evidence. We have only scratched the surface of the commands that are available and defined a logical process for collecting system information, volatile information, identifying files containing system memory, collecting, and correlating running processes with current network activity.
Post a Comment